Home » Projects » Environmental Inequalities in NYC
Environmental Inequalities in NYC
What are the current patterns of environmental inequalities in New York City, and do trees and green spaces help address such environmental inequality?
This repo states our evaluation on the overall pattern of environmental inequality by comparing neighborhood land surface temperature and socio-economic data. We combined the following variables describing environmental amenities and negative externalities to explore the causes of these urban inequalities.
The full report is here.
To see a story-map based on our analysis, please click here.
Dataset
Dataset 1: New York City 2015 Tree Census
This dataset includes the geographic coordinates of all trees in New York City and their species, diameter and perceived health. This data is publicly available on the city’s Open Data Portal and contains 684-thousand entries. The data was last updated in 2017. We have aggregated the tree count and tree density data for each of the over 6,000 block groups.
Dataset 2: New York City Pollution Data
This dataset is also retrieved from the NYC Open Data Portal. Due to the low resolution of the dataset and the small size of lots of city-center block groups, we were only able to obtain average values for around 4,100 block groups.
Dataset 3: Green View Index Generated from Google Street View
This dataset contains the Green View Index in New York City, sampled along the roads with a minimal distance of 200m. The data source includes Google Street View images, New York City road network data from NYC Open Data Portal, and the Semantic Segmentation model based on the MIT ADE20K dataset. The data was retrieved in March 2022. Google Street View images include images from 2012 to 2022, in which only the “green month” images with visible greenery are used. On estimation, approximately 14,000 Google Street View images will be collected, which will be integrated into 2400 observations of the Green View Index.
Dataset 4: Land Surface Temperature
We obtained USGS Landsat 8 Collection 2 Level 2 data through Google Earth Engine. The Band 10 of this dataset contains remotely sensed temperature data calculated from radiations with atmospheric conditions corrected in advance. Because this dataset is at a high resolution of 30 meters, we were able to calculate an average for over 6,000 block groups. We are still in the process of compiling all the data needed to conduct further regression analysis as some data processing –– particularly the creation of the Green View Index –– is time-consuming due to the amount of data that needs to be downloaded and categorized. The final goal of data processing is to produce one table which contains the values to all the variables we want to investigate for each of the over 6,000 block groups in New York City.
Data Visualization (snippet)
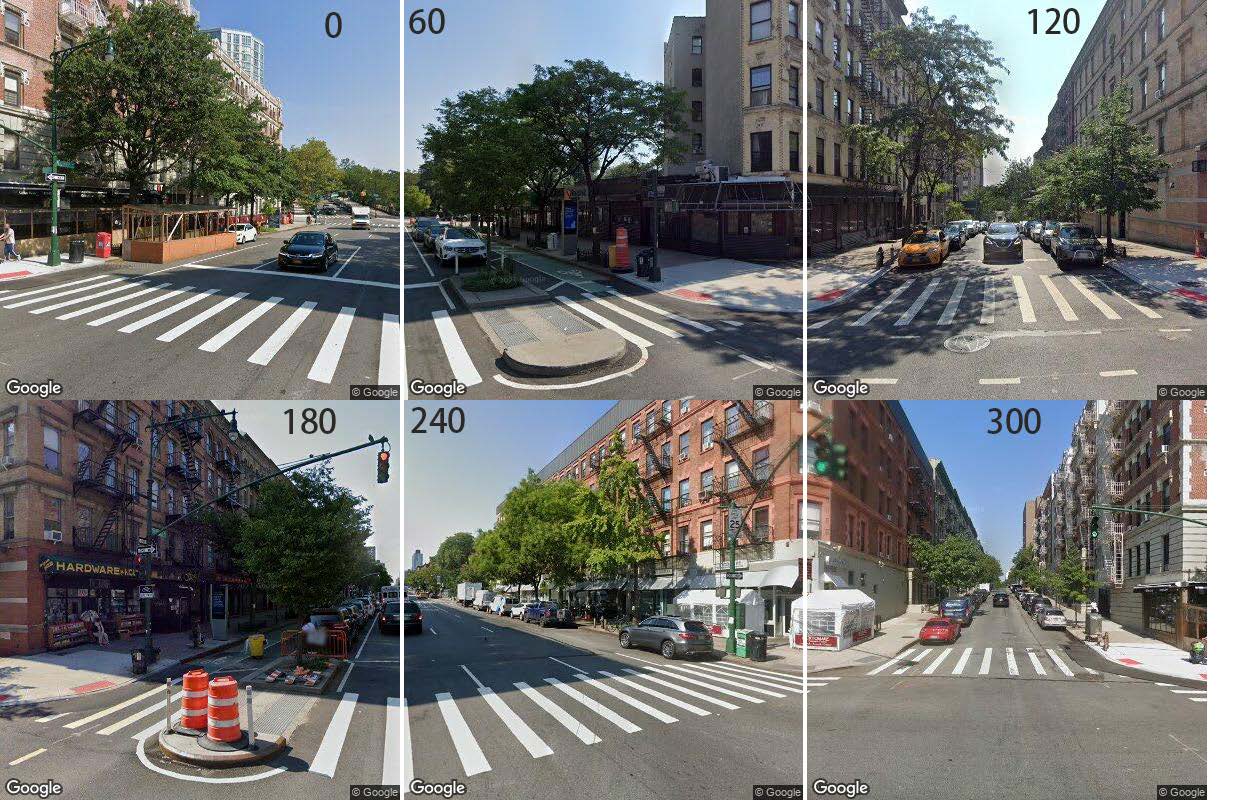 Figure 1: Sample GSV images fetched. The numbers on the image stand for the heading of the
image. The six images combined provide a panorama of a given position.
Figure 1: Sample GSV images fetched. The numbers on the image stand for the heading of the
image. The six images combined provide a panorama of a given position.
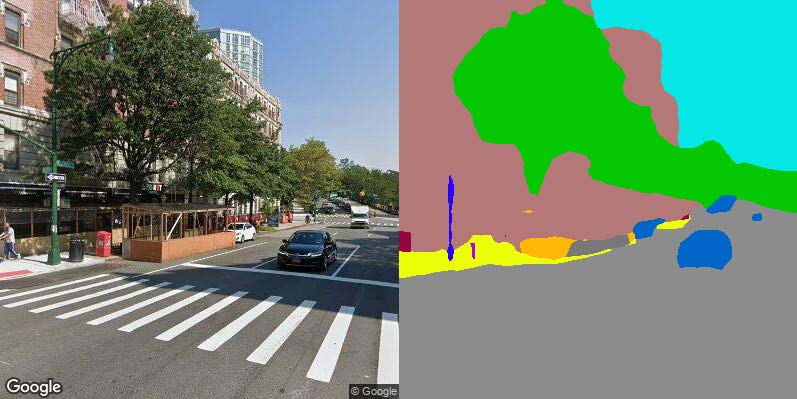 Figure 2: Predicted vegetation result created from the MIT ADE20K scene parsing dataset.
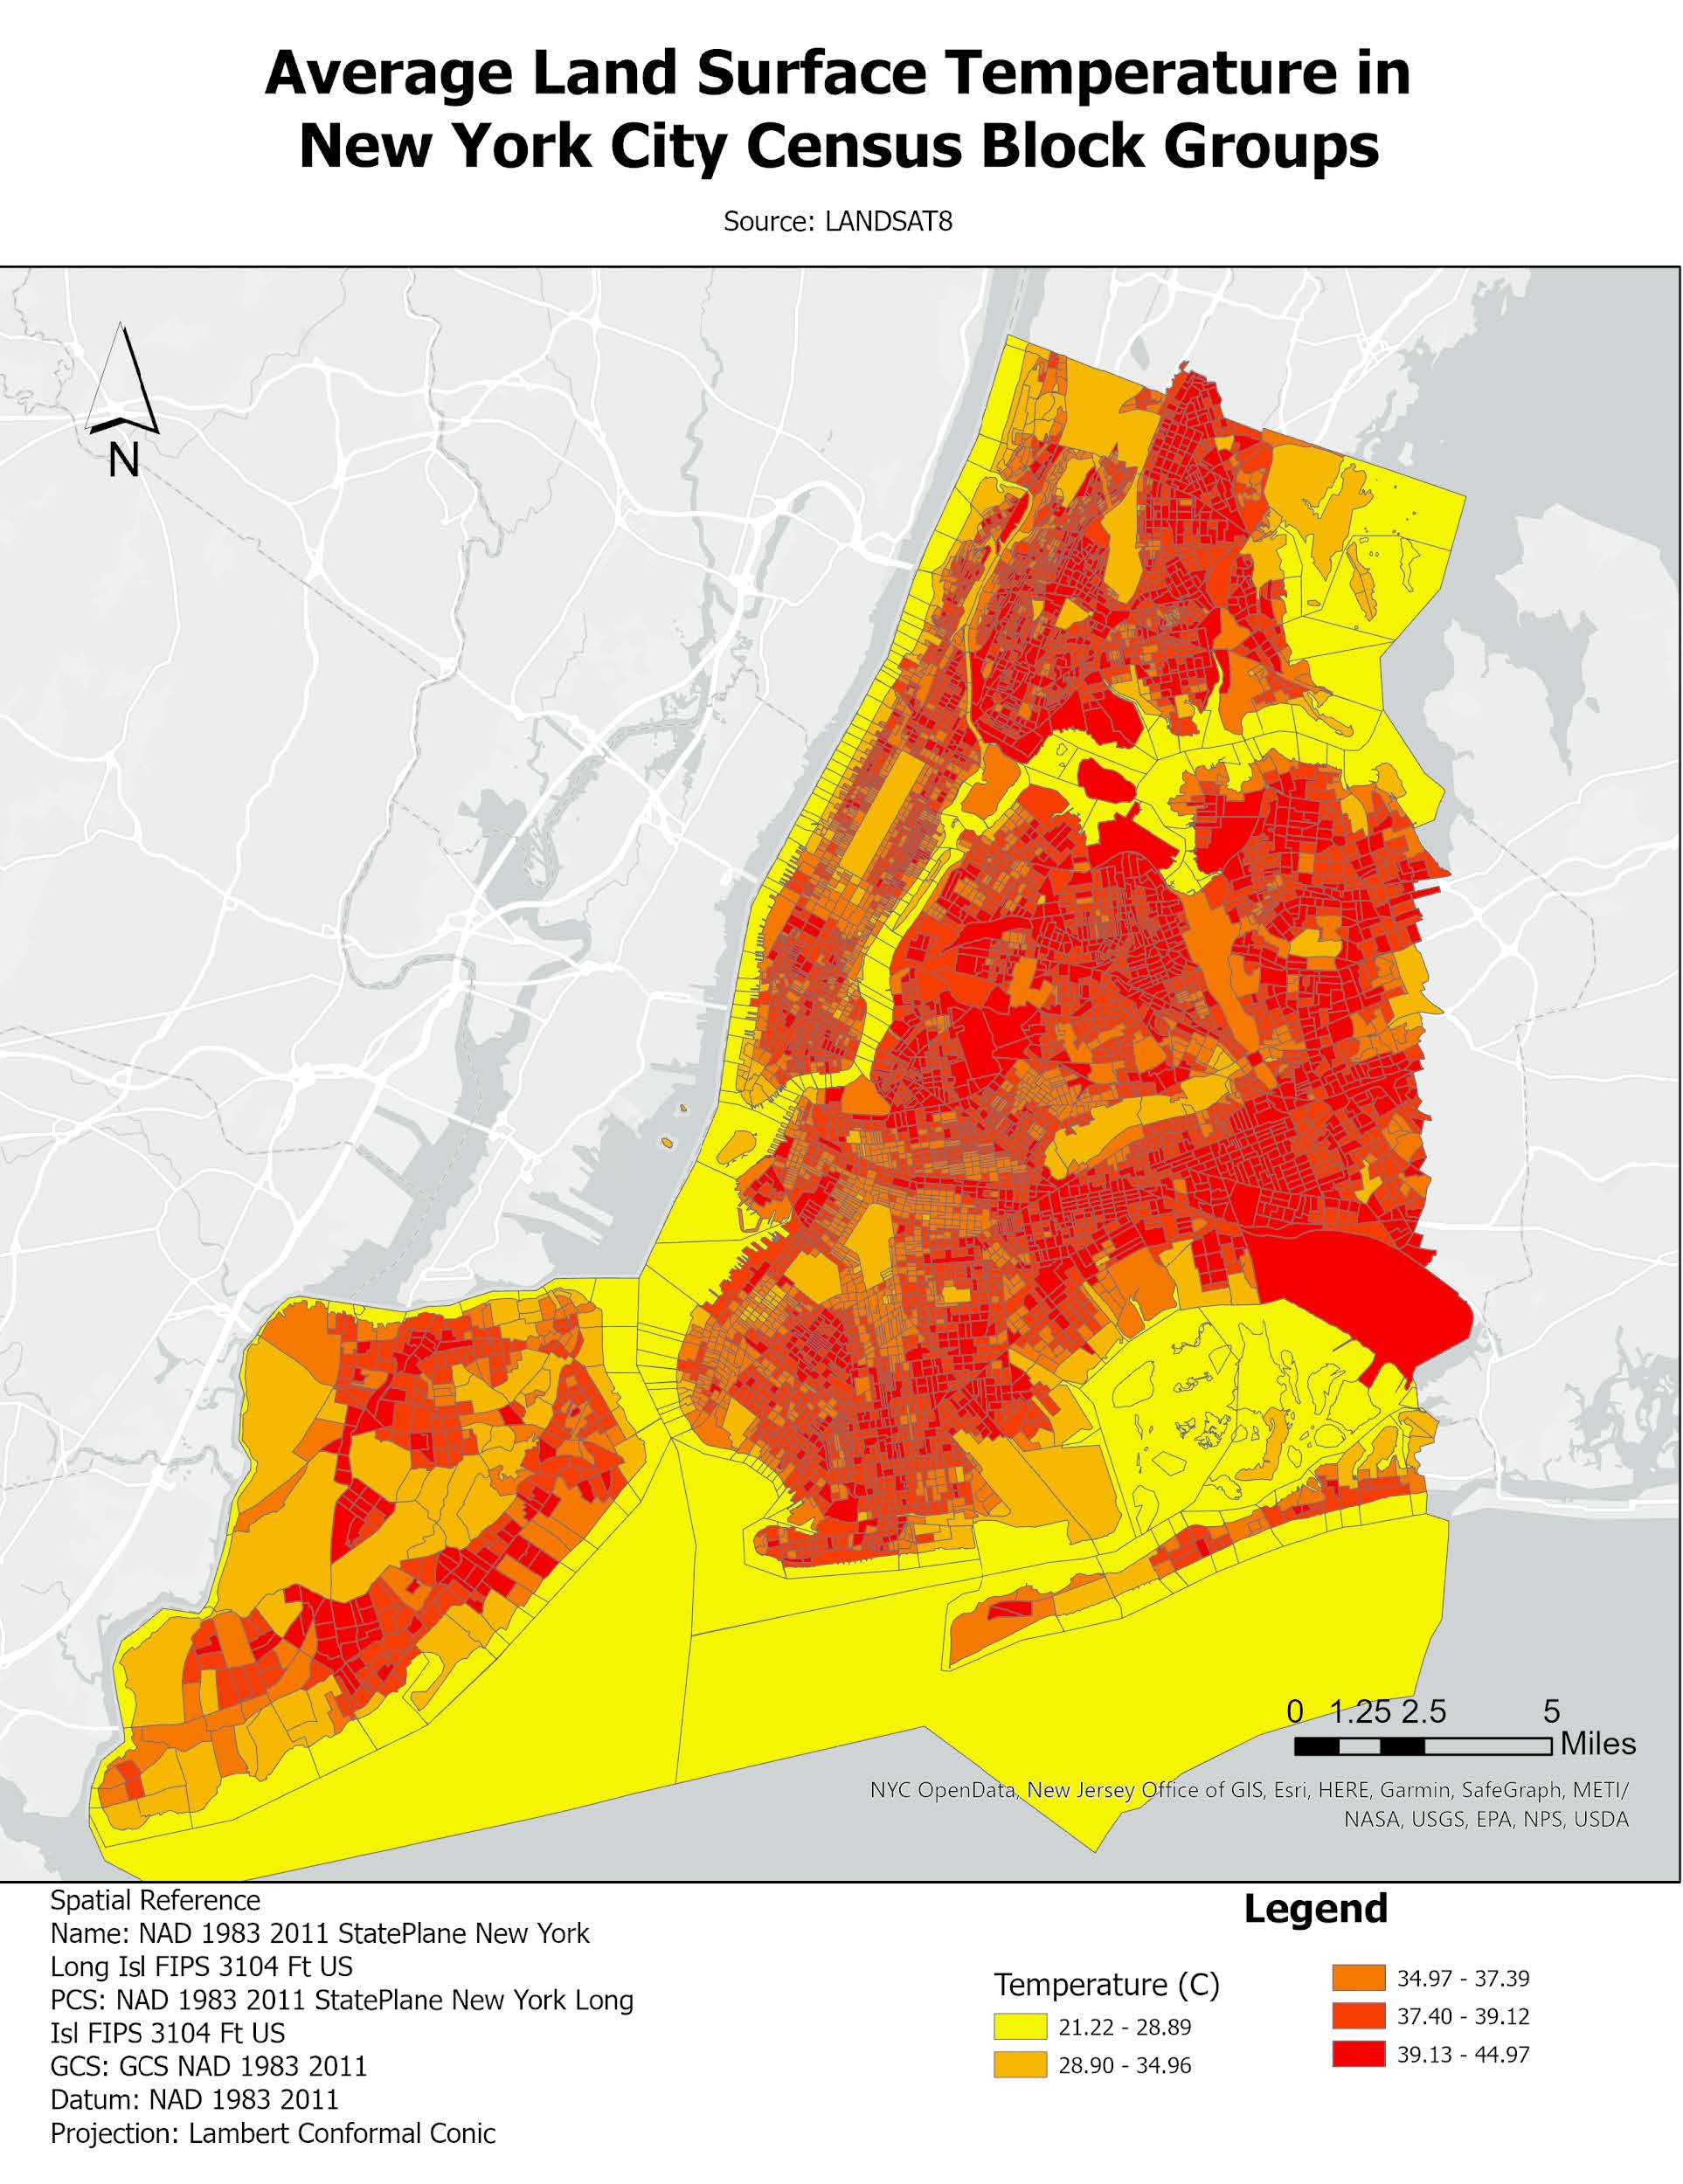
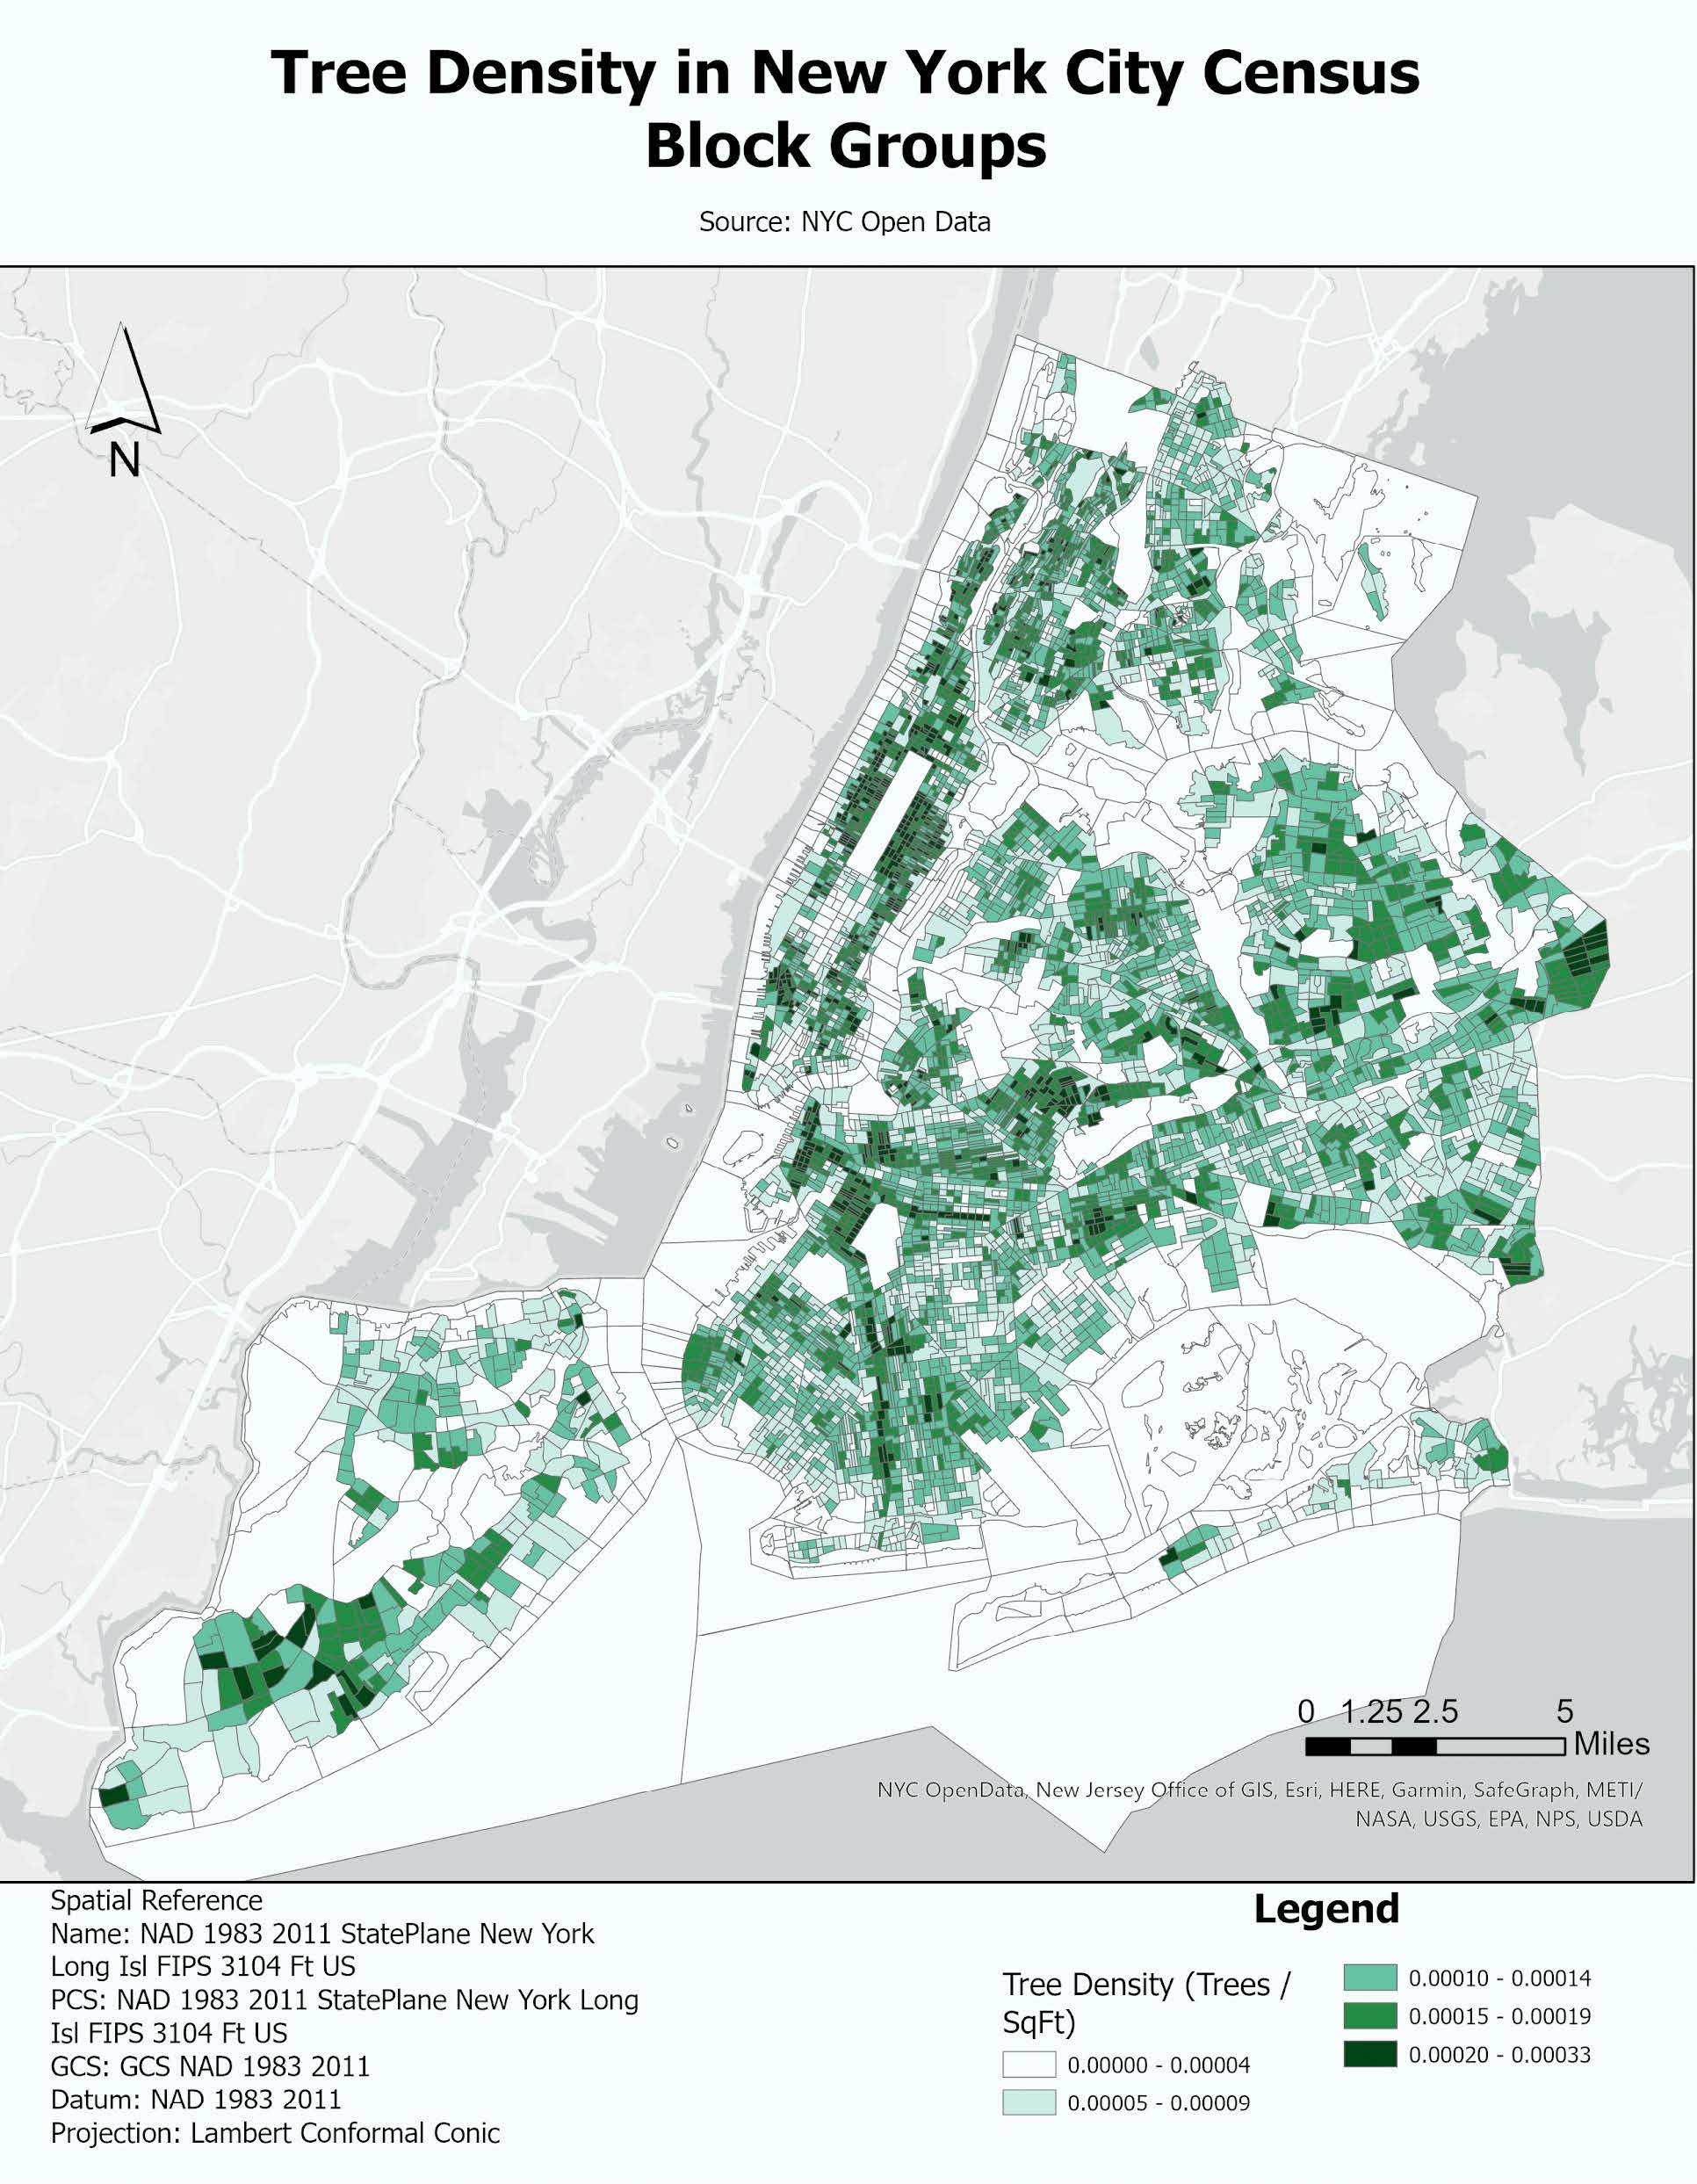 Figure 3,4: Visualization of Average Land Surface Temperature and Tree Density Data in New
York City by Block Groups
Figure 3,4: Visualization of Average Land Surface Temperature and Tree Density Data in New
York City by Block Groups
Conclusion
Based on our research and analysis, we conclude that environmental inequalities continue to exist across race, income, and education lines, while urban greeneries are effective at reducing urban temperature. We based the first part of our conclusion on the evidence that the patterns of surface temperature correlate significantly with neighborhood racial composition, median income, and percentage of residents with a Bachelor’s or higher degree. We also found PM 2.5 levels to be consistently higher in neighborhoods with a larger non-white population. On the other hand, minority and low-income neighborhoods also have consistently lower levels of urban greenery. The second part of our conclusion is informed by the clear negative correlation between mean GVI and surface temperature. Although we were unable to arrive at a definitive conclusion on the effect of urban greenery on pollution, the significant relationship between urban greenery and surface temperature suggests that trees can be considered a tool to combat existing environmental inequality at least in New York City.